

Visual Studio Code comes with settings to launch node or mocha executables in order to debug our systems, and also with tasks. A task can be configured to transpile our TypeScript files to JavaScript automatically, as soon as we change them. This post is based on the configuration we did in the previous post, which was about testing with Mocha.
Configuring a new launch for debugging our Node.js system
Inside the project you opened in Visual Studio Code, there’s a directory called .vscode. Open the launch.json file inside of it and add the Mocha settings:
1
2
3
4
5
6
7
8
9
10
11
12
13
14
15
16
17
18
19
20
21
22
23
24
25
26
27
28
29
30
31
32
33
{
    // Use IntelliSense to learn about possible Node.js debug attributes.
    // Hover to view descriptions of existing attributes.
    // For more information, visit: https://go.microsoft.com/fwlink/?linkid=830387
    "version": "0.2.0",
    "configurations": [
        {
            "type": "node",
            "request": "launch",
            "name": "Launch Program",
            "program": "${file}"
        },
        {
            "name": "Run mocha",
            "type": "node",
            "request": "launch",
            "program": "${workspaceRoot}/node_modules/mocha/bin/_mocha",
            "stopOnEntry": false,
            "args": [
                "--no-timeouts",
                "--colors"
            ],
            "cwd": "${workspaceRoot}",
            "sourceMaps": true,
            "outFiles": [
                "${workspaceRoot}/bin/**"
            ],
            "env": {
                "NODE_ENV": "test"
            }
        }
    ]
}
Ps: If this directory is not there, then open the Debug view inside Visual Studio Code (Ctrl + Shift + D) so the option to create it will be presented to you.
After saving this file with the Mocha options, when you go to the Debug view, you’ll see “Run mocha” as one of the options for running the debugger. That’s our newly created launch config.
Running the tests and using the debugger
When you click on the play button it will start running the tests inside the bin/test directory, if you followed the configuration I created on my previous post about testing with Mocha. If there’s no bin directory yet with the transpiled TypeScript, then you’ll have to run gulp before to create it and run the gulp tasks.
This is the result of the tests running inside Visual Studio Code using Mocha:

Before running the debugger, you can also set a breakpoint in the code by clicking on the line you want, before the line number. When you run the tests and at least one of the tests access this part of the code, the debugger will stop there and show the current state of the variable(s) in the line where you put the breakpoint. It shows all the properties of a json object, for example, if you hover it with the mouse pointer.
The breakpoints can be set in the TypeScript file, but if that doesn’t work, you can set them in the JavaScript file you want inside the bin directory and the sourcemaps will be used to show the TypeScript code instead of the JavaScript one when the debugger runs.
Click on the image below to enlarge:
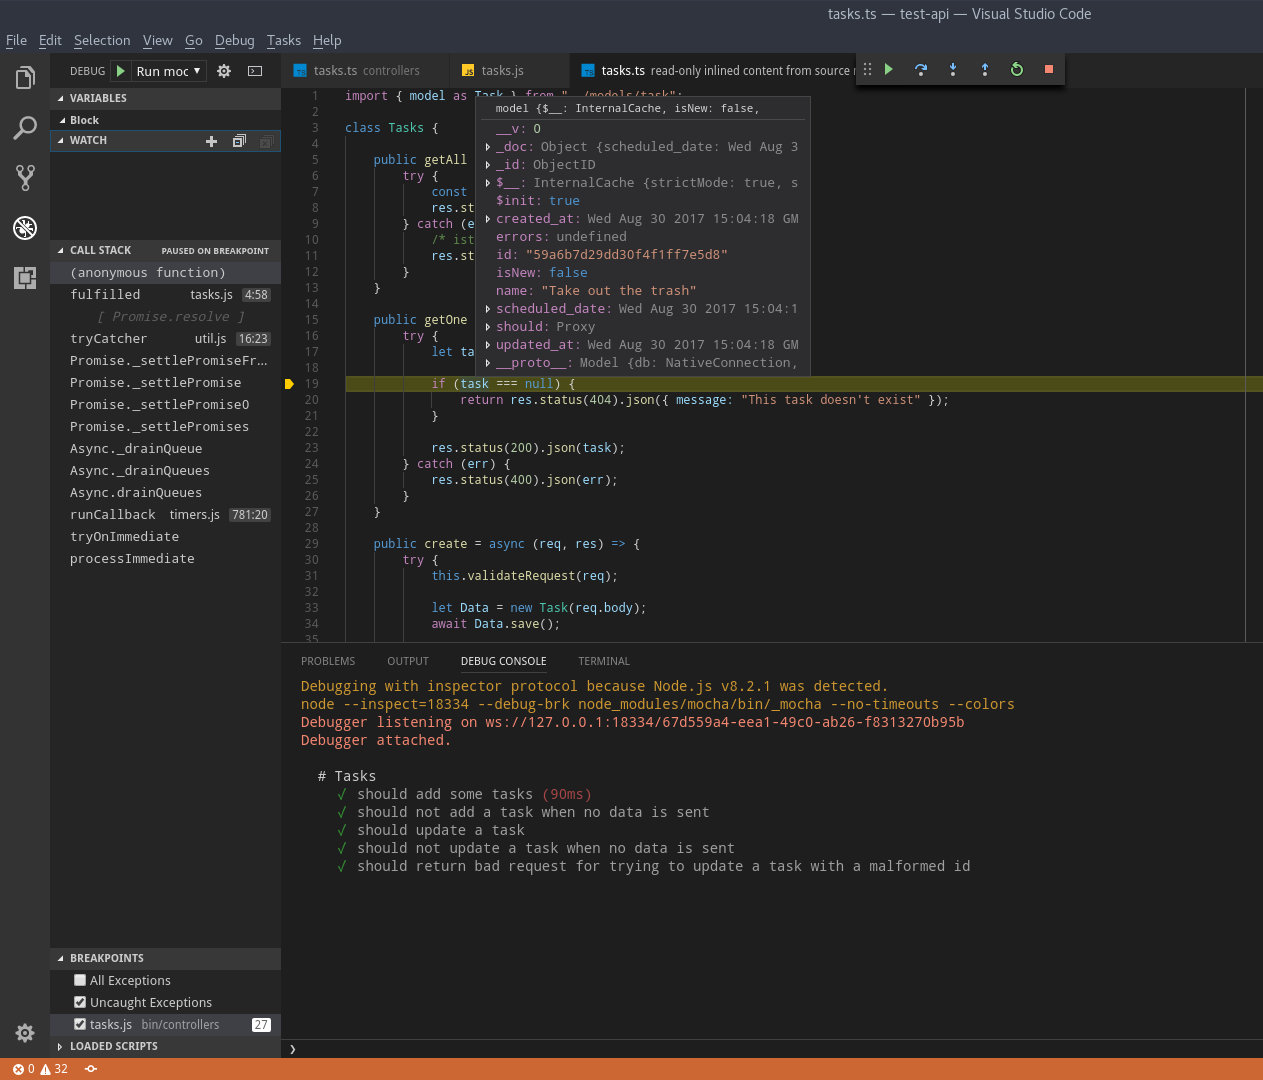
In the bottom left corner you can see the breakpoints that you configured.
If you want to execute only the tests you want to debug, then change the “it” inside the tests file to it.only. For example:

Here only two of the tests will be executed.
This way you are able to debug only the parts you want and get to the breakpoints you configured faster.
As you can see in the top, we have the debugger controls. Play (F5) will go to the next breakpoint, step into (F11) will go to the next line, and step out (Shift + F11) will exit a method or loop and go to the next instruction if you need.
Configuring a transpilation task for TypeScript
If you press Ctrl + Shift + B now and you have no tasks configured, Visual Studio Code will run some detections and give you suggestions. For a TypeScript project it will show you “tsc: build - tsconfig.json”, which will be a task based on the tsconfig.json file you have on your project. Choose that option so it starts running in the terminal and watching for changes.
Here I renamed the method getOne to getOne1 in order to test it and it transpiled the tasks.ts file automatically to bin/tasks.js with the new method name, but it showed an error, since getOne is being called inside the tasks.ts route and it doesn’t exist anymore.
Click on the image below to enlarge:
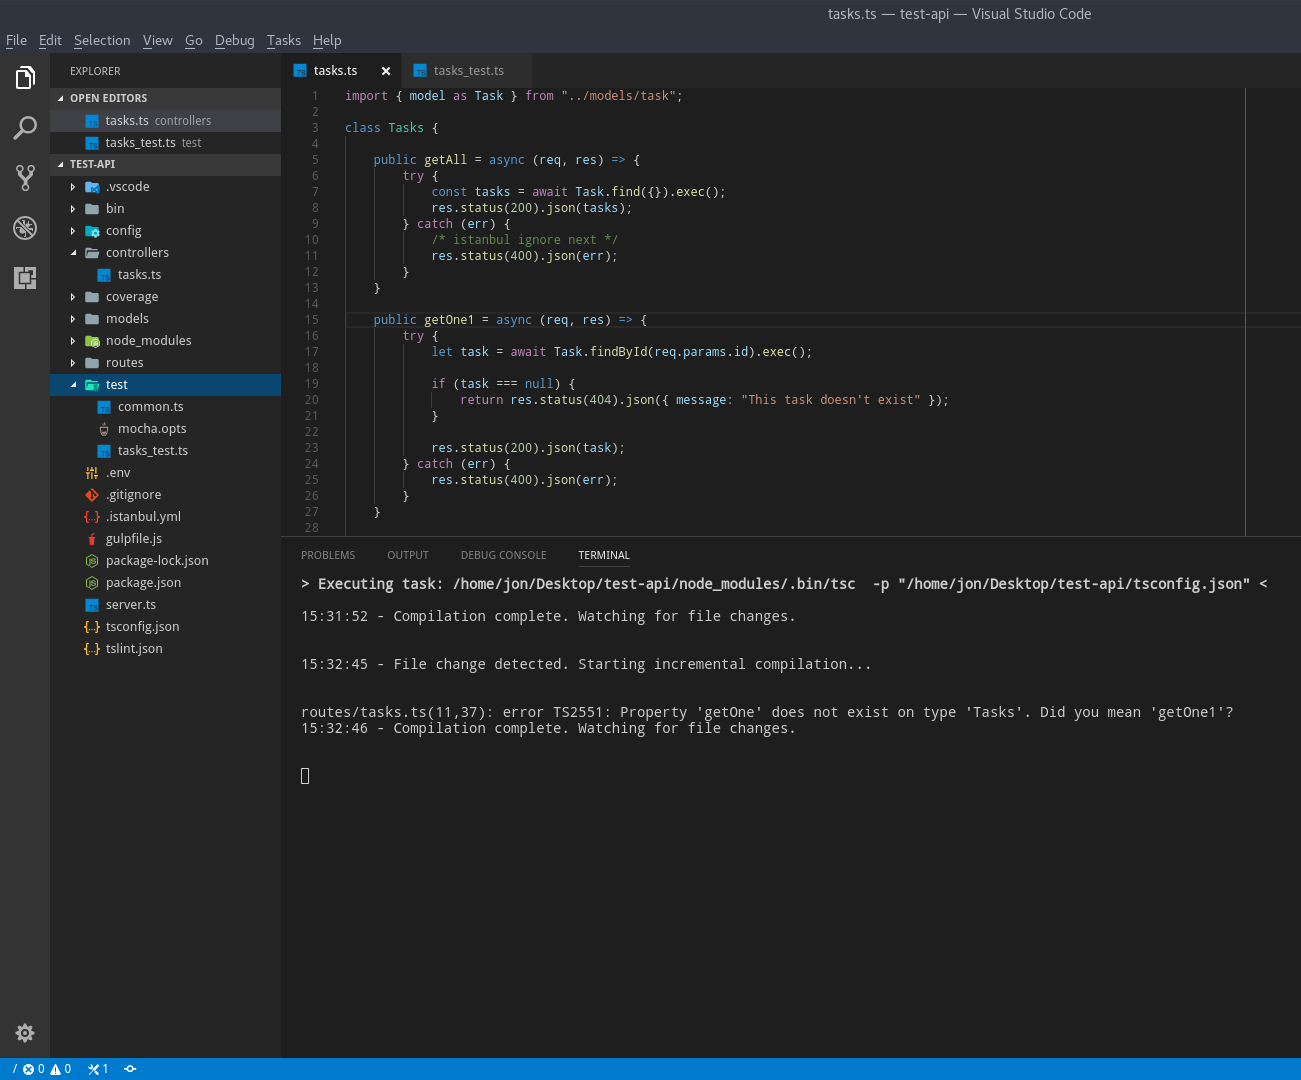
The first icon in the bottom left corner, before the circled X, will be always moving while a task is active.
In order to stop the task, press Ctrl + C while the focus is on the terminal.
Conclusion
This puts an end to the need of console.log commands everywhere on your source code, as this debug feature on Visual Studio Code works pretty well.
Is there any other task or tip you have for Visual Studio Code you know and like to use? Let me know in the comments!